UC Berkeley Chemists Installing Carbon Dioxide Sensors in Oakland
The City of Oakland will be ground zero for the first urban sensor network to provide real-time, neighborhood-by-neighborhood measurements of carbon dioxide – a greenhouse gas that contributes to global warming – and other air pollutants.
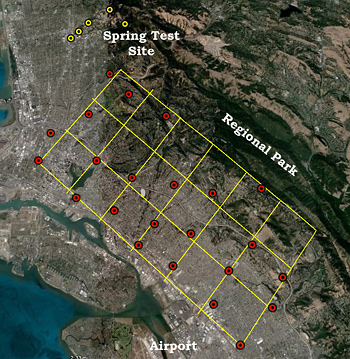
The prototype network, being installed by chemists at the University of California, Berkeley, will employ 40 sensors spread over a 27 square-mile grid, most of them mounted atop local schools to engage students in the project. The information the network will provide could be used to monitor local carbon dioxide emissions to check on the effectiveness of carbon-reduction strategies now mandated by the state, but hard to verify.
“Today, we monitor air quality in the entire East Bay from only about a dozen stations, but that gives you an average that may not be representative of what’s happening where you live,” said project leader Ron Cohen, UC Berkeley professor of chemistry. “The advantage of many, many sensors is that the network captures the whole range of pollutant sources, from freeways to homes. This could inspire communities to think about local actions to change the CO2 they emit.”
The state has committed to a cap and trade strategy as an attempt to lower carbon emissions, and the Bay Area Air Quality Management District instituted a carbon fee on regional businesses in 2008. But carbon taxes rely on reports by local agencies and businesses that estimate their emissions based on assumptions that may be wrong, such as the amount of carbon dioxide emitted when pouring concrete.
UC Berkeley graduate student Virginia (Jill) Teige, who designed the sensors, said “no one is actually measuring CO2 at a fine enough resolution to confirm whether the reports are right or not. The idea of putting up a network to monitor emissions is like measuring how fast everyone is driving in order to confirm that people are abiding by the speed limit.”
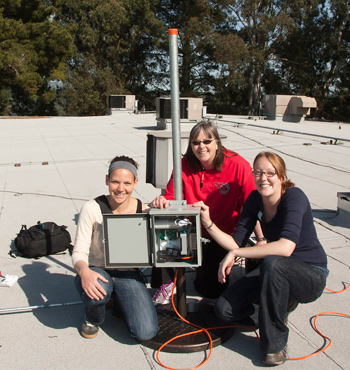
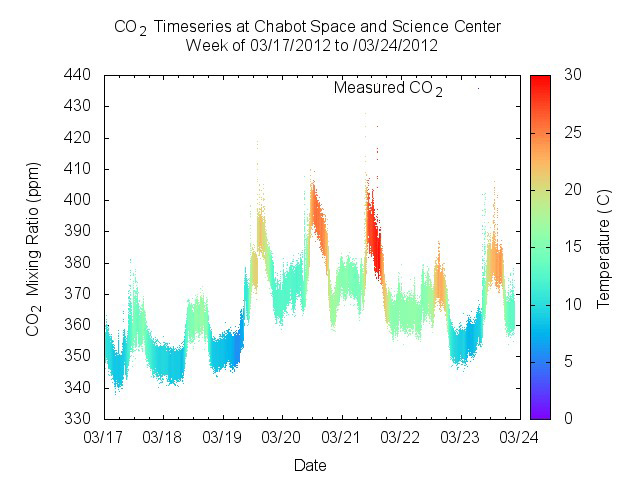
Built and installed by Cohen, Teige and their lab colleagues, the shoebox-size sensors will continuously measure carbon dioxide, carbon monoxide, nitrogen dioxide and ozone levels as well as temperature, pressure and humidity, streaming the information live to the Web through the site http://beacon.berkeley.edu.
“One of my fantasies is that the local news will show a video of the day’s changing CO2 levels, just as it shows the movement of weather fronts,” Cohen said.

Network stretches from hills to bay
The sensor network, dubbed BEACON (Berkeley Atmospheric CO2 Observing Network), stretches from the East Bay Regional Parks on the east to Interstate 880 on the west, and from El Cerrito on the north nearly to the San Leandro border, encompassing open space as well as heavily trafficked areas.
Most of the sensors are being mounted on the roofs of local schools, Cohen said, in order to get students interested in the connection between carbon dioxide emissions and climate change. The UC Berkeley researchers work with Oakland’s Chabot Space & Science Center to create middle school and high school activities using live sensor data streamed through the Web as part of the students’ energy and climate science curriculum.
“As soon as we heard about the sensor project, we thought it was so timely, clever and relevant to our mission – to inspire young people to take responsibility for Planet Earth, and to learn about climate science,” said Etta Heber, director of education at Chabot. “We are thrilled to be working with Ron and his team to engage the K-12 community in cutting-edge science.”
Tracy Ostrom, a teacher in the Green Energy Academy at Skyline High School who participated in Chabot’s training, is eager to incorporate the sensor data in her classroom work, as well as host UC Berkeley graduate students who can show her students “what field science is all about, which can help the students define their interests in pursuing a career in this type of field.”
“As students are instructed on greenhouse gases and global climate change, they will also see how the BEACON project can potentially influence national and global policy making,” she wrote in an email.

Nine of the sensors are now in place at Chabot, the Oakland Zoo, two high schools and five elementary schools. Others are ready to install, pending approval by school officials.
Two are reserved for the new Exploratorium in San Francisco, which is scheduled to open next year on Pier 15 and includes an exhibit on CO2 and climate change. The sensors could detect the fumes from a passing ship or the effects of a “Spare the Air” day, Cohen said.
Off-the-shelf parts make monitoring cheaper
Cohen and his UC Berkeley colleagues have built refrigerator-sized monitoring equipment for years, each package costing up to $250,000, but providing exquisitely precise and detailed data. The new sensor packages cost one-twentieth as much because they make use of off-the-shelf devices, such as a nitrogen dioxide sensor identical to that found in industrial toxic gas alerts.
The BEACON network is a pilot program funded by the National Science Foundation to determine what information can be learned from a densely spaced network. Lower cost means less sensitive instruments, but the precision should be offset by sheer numbers, Cohen said.
“A massive number of inexpensive sensors as common as cell phone towers will fundamentally change our knowledge,” said Cohen, who directs the Berkeley Atmospheric Science Center. “Real time observations will enable rapid verification of the effectiveness of policy and compliance with treaties and other agreements and commitments.”

Teige noted that the current sensors will be placed about two kilometers apart. “How closely spaced these sensors need to be in an optimal network is still an open question that we intend to address with this pilot, before expanding the network to other cities and the entire Bay area,” she said.
Each sensor is connected to the Internet, many of them wirelessly, so they can send measurements every five seconds to a computer in Hildebrand Hall on the UC Berkeley campus. Cohen and Teige hope to have all 40 sensors in place by the end of the summer, just in time for the opening of classes in local schools.
“I’m anxious to see the data that will come out,” said Chabot’s Ben Burress, who developed the teaching guides and is training teachers how to use data visualization software to display sensor data. “I think it’s fantastic that Ron wants to complement his research with real-time science in the classroom.”
RELATED INFORMATION
