Novel technique reveals how glaciers sculpted their valleys
The beautiful and distinctive U-shaped glacial valleys typical of alpine areas from Alaska to New Zealand have fascinated and frustrated geologists for centuries.
While it seems obvious that glaciers scoured the bedrock for millions of years, what the landscape looked like before glaciers appeared, and how the glaciers changed that landscape over time, have remained a mystery. The glaciers erased all the evidence.
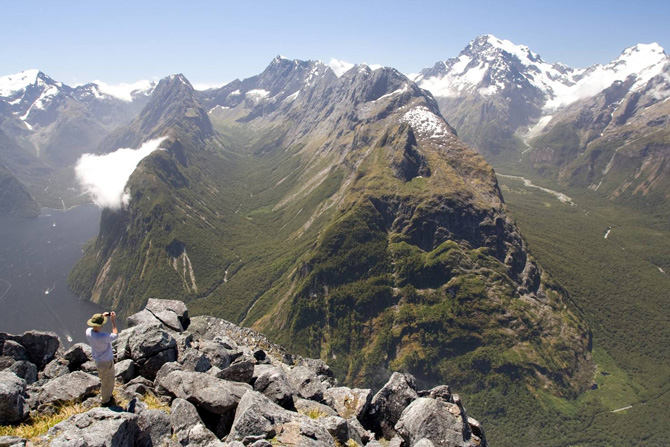
Now, University of California, Berkeley, and Berkeley Geochronology Center (BGC) scientists have employed a clever technique to reconstruct the landform history of a 300-square-mile area of Fiordland in New Zealand, from the early Pleistocene some 2.5 million years ago, when the world cooled and glaciers formed, through today’s warmer interglacial period.
“The first question we asked was, how much of the current landscape and relief is a result of glacial erosion?” said David Shuster, who developed the novel technique, called helium-4/helium-3 thermochronometry. “The answer is, all of it.”
Shuster is an associate adjunct professor of earth and planetary science at UC Berkeley and a geochemist at the Berkeley Geochronology Center.
“Geologists have wondered, what did the landscape look like 200,000 years ago, or 400,000 years ago, or back before the Pleistocene glaciations began?” said glaciologist Kurt Cuffey, professor and chair of geography and a professor of earth and planetary science at UC Berkeley. “Did the valleys start out as V-shaped canyons submerged in ice, and the glacier just widened and deepened them? Or perhaps the relief was sculpted by glaciation, and it didn’t matter what the rock landscape looked like before.”
“David’s work opens up a whole new world of investigation to tell us how the alpine landscape progressed, with implications for how glaciers today act on the landscape,” he said.
Shuster, Cuffey, UC Berkeley graduate student Johnny Sanders and BGC researcher Greg Balco report their conclusions in the April 1 issue of the journal Science.
Glaciers carved their mouths first, then their heads
The team found that in the Fiordland, a well-known tourist destination in the Southern Alps of New Zealand, the rock currently on the surface was about 1.5 miles (2 kilometers) underground when the glaciers began forming about 2.5 million years ago. Since then, the mountains rose as a result of tectonic activity, while the glaciers flowed downhill, scouring the landscape and gouging U-shaped valleys on their way to the sea.
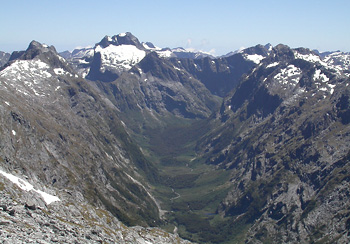
What surprised the geologists was that most of the valley-making occurred at the downstream mouths of glaciers for the first million years, essentially stopping about 1.5 million years ago. For the next million years, until about 500,000 years ago, erosion took place primarily at the heads of glaciers, which steadily ate into their headwalls, characterized by steep, amphitheater-like cirques. As a result, the deep valleys advanced up their drainage basins toward the range divide, producing razorback ridges in the process.
“Apparently, the heads of glaciers would be directly opposite one another on either side of a high ridge, and faster erosion at the headwalls caused the glaciers to eat their way inward to the spine of the mountain range, farther from the glacier’s outlet,” Cuffey said.
Major changes to the mountain topography essentially stopped about half a million years ago. The current interglacial period started about 12,000 years ago, after warming temperatures caused the glaciers to melt and recede. The fact that these Fiordland valleys are now ice-free allowed the researchers to collect surface rock samples from 33 sites in four glacial valleys over six days with the assistance of a helicopter. The valleys end in Milford Sound or Lake Te Anau.
Temperature as a proxy for depth
Shuster developed helium-4/helium-3 thermochronometry while a graduate student at Caltech, from which he obtained his Ph.D. in 2005. The technique makes it possible to determine the temperature of a mineral as it cooled over geological time. Because temperature increases with depth, the temperature history of the mineral tells how deeply it was buried over a period of millions of years.
“The technique allows us to collect samples from the present surface and, based on observations, infer how they cooled through 80 degrees Celsius to 20 degrees Celsius (176 to 68 Fahrenheit) over the last few million years, and thus, how deep they were when they cooled,” Shuster said.
At the moment, the technique works only with crystals of apatite, a calcium phosphate mineral found mainly in plutonic rocks, such as granite, that solidify from magma deep underground. The apatite crystals contain uranium and thorium, which over millions of years decay radioactively, producing helium-4. The helium gradually leaks out of the crystal into the surrounding rock, but the rate of leakage decreases as the crystal cools.
Using special equipment at the BGC, the geologists were able to date the cooling of the minerals by measuring the amount of uranium and thorium in each crystal as well as the total amount of helium-4. The new technique involves irradiating the crystal with a proton beam to create helium-3, then measuring the outgassing of both helium isotopes to obtain a cross section of the helium-4 concentration in the crystal. They then calculated the crystal’s cooling history based on the helium diffusion rate.
The samples, all of them younger than 2.5 million years, showed a large range of temperature, and thus depth, histories. Cuffey and Shuster used a computer model to test various scenarios and concluded that only one fit the data: Glaciers initially scoured the U-shaped valleys on the flanks of the mountain range, and only later began eating away at their headwater regions, including cirques and drainage divides.
“… this morphology resembles modern analogs in Norway and Antarctica, where steep valley ramps descend to level floors,” the authors wrote.
The common thread is that the rock erodes faster where the ice sits on a steep slope, they said. Thus, the erosion rate of a glacier is greatest where the flowing river of ice descends steeply downstream.
“This scenario is consistent with a subglacial erosion rate dependent on ice sliding velocity, but not ice discharge,” Shuster said.
Cuffey, coauthor with W. S. B. Paterson of the fourth edition of the book “The Physics of Glaciers” (2010), hopes to use the new information to improve computer models of glacial sculpting of landscapes. Meanwhile, Shuster and Cuffey plan to apply thermochronometry to chart the history of Yosemite National Park before and after the arrival of Pleistocene glaciers, going back as far as 40 million years into the Cenozoic era.
The research was supported by the National Science Foundation. The work of the BGC was supported by the Ann and Gordon Getty Foundation.