New Study Evaluates NOAA’s Wildfire Smoke Forecasting Model
As wildfires become more frequent and severe due to climate change, it’s increasingly important to determine how and when the resultant smoke will move toward communities, both near and far from the area that is burning.
To assist with predictions, in 2016 the National Oceanic and Atmospheric Administration (NOAA) Global Systems Laboratory added a new experimental tool to their weather forecasting model, High-Resolution Rapid Refresh (HRRR). Known as HRRR-Smoke, it is the only real-time 3D high-resolution U.S. weather forecasting model that predicts the movement and concentration of smoke.
Using data collected by weather satellites, such as the radiative energy from a fire, the model estimates the amount of smoke emitted; it then computes wind speed and direction to predict where and when the smoke plume will travel, how dense it will be and its impact on weather and visibility.
To test its abilities, NOAA turned to Tina Katopodes Chow, UC Berkeley professor of civil and environmental engineering, and her students. Their test results, published last month in the Bulletin of the American Meteorological Society, showed that the model was able to accurately predict the general movement and concentration of the smoke plume, including wind speed and other weather variables affecting smoke distribution.
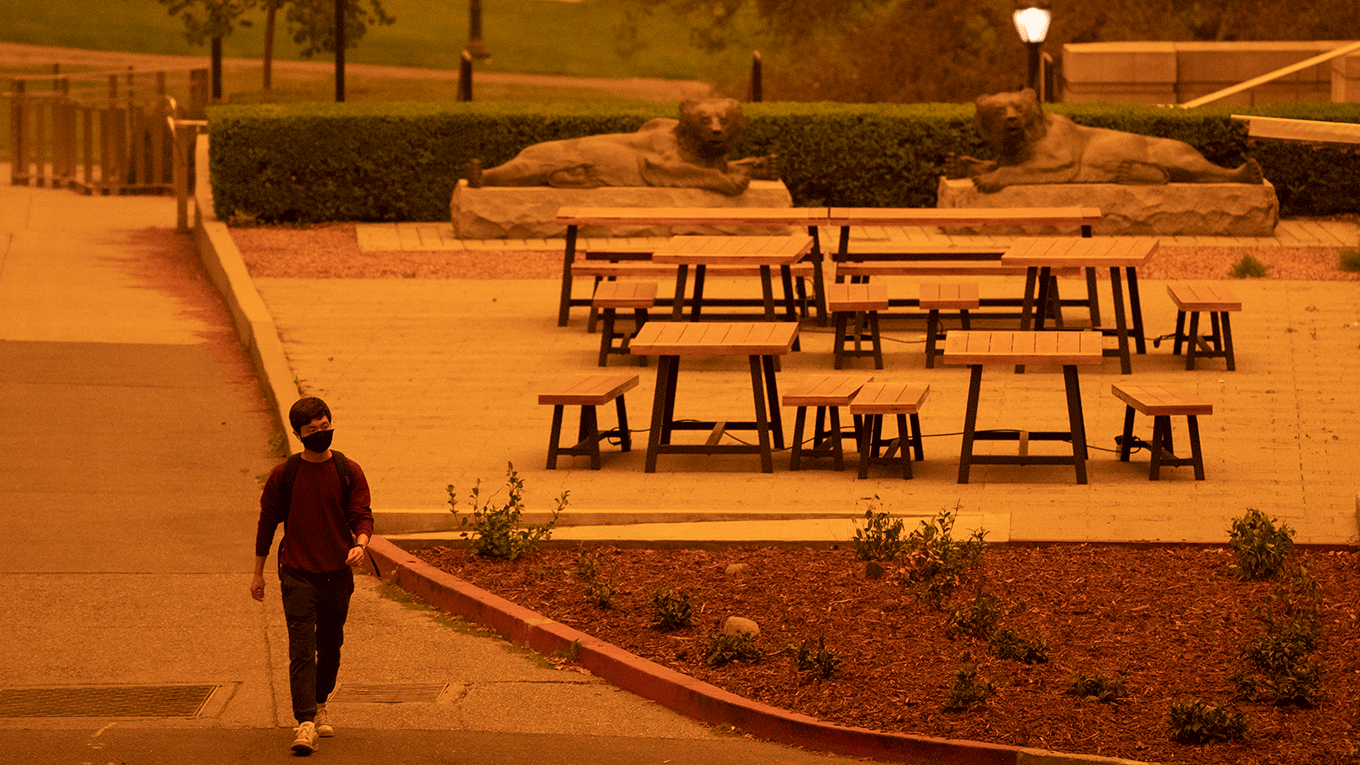
The collaboration began as a result of the 2018 Camp Fire in Paradise, CA, which resulted in 88 deaths and blanketed the San Francisco Bay Area and Central Valley with dense smoke for two weeks. When Chow was looking for information on when the smoke might clear, she found the HRRR-Smoke model, which was still in experimental mode. After noticing some inaccuracies — for example, smoky days when the model had predicted clear skies — she contacted the developers and offered to help test it.
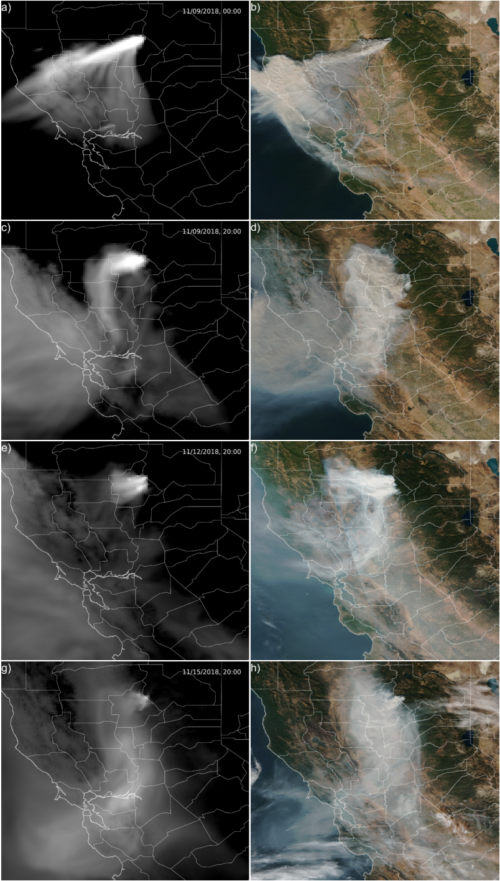
Using the Camp Fire as a test case, the researchers compared the results of the model’s forecast to data from local weather stations and air quality sensors. Their analysis found that HRRR-Smoke successfully forecast the general movement and concentration of the smoke plume, especially given the complex terrain and wind conditions that created this wildfire event.
“The model did a very good job. You could use it for overall predictions of how long the smoke is going to last over a certain area, and you could with confidence say this part is not going to be smoky,” said Chow. “You can see that there’s an overall pretty good agreement, but there are some details that are obviously always going to be different.”
The testing also identified aspects of the model that could be improved. For instance, the differences in the details between the actual and modeled smoke plume were due to small errors in wind direction, which led to bigger discrepancies in the smoke’s pathway. The researchers also found that the arrival of the smoke in the Bay Area as predicted by the model was delayed from reality by several hours due to how fires are detected, pointing to a need for better satellite fire detection.
“One of the main limitations that we found was that the current fire detection methods from polar-orbiting satellites may not detect a fire until several hours after it starts and thus gets incorporated into the model late. This will create a delay in the spread of smoke and leave room for uncertainty,” said Katelyn Yu, a civil and environmental engineering doctoral student and co-author of the study. Including high-frequency fire detections from geostationary satellites in the future would help fires be detected more rapidly in the model.
In predicting the spread of smoke, the model correctly captured the changes in concentration of air pollution experienced in the region during the first week of the fire. However, as the fire moved into the second week, the model underpredicted these levels. On some days, the model undershot actual pollution concentrations by 70%; the researchers believe that the smoke plume itself may be the cause of this error.
“What we think happened is that, because the smoke was so thick or because on some days it was cloudy, the satellites couldn’t even see the ground, so they weren’t picking up the proper signal. In the model, the fire got weaker and weaker because it missed the detection of the fire,” said Chow. “To complement the satellite detections in the future, we need to assimilate additional datasets into our smoke forecast models, for example the ground-based PM2.5 measurements.”
The HRRR-Smoke model became operational in 2020, and NOAA Global Systems Laboratory researchers continue to improve the smoke forecast models. The findings of this study help to identify the critical needs for model development.
With wildfires now regularly occurring in many regions year-round, the model’s unique ability to forecast the spread and density of smoke makes it a vital tool in continually protecting people’s health.
“Many people suffer from asthma and other respiratory illnesses, so these types of forecasting tools are essential to helping people better prepare and know when they should expect to experience hazardous levels of air pollution,” said Yu.
Other co-authors of the study include researchers at NOAA Global Systems Laboratory, the Cooperative Institute for Research in Environmental Sciences at the University of Colorado Boulder, NOAA Center for Satellite Applications and Research, the I.M. Systems Group, the Universities Space Research Association, NASA Goddard Space Flight Center, the Federal University of São João del-Rei in Brazil and the University of Maryland.