New site maps state’s severe traffic collisions
Researchers at the University of California, Berkeley, are launching a powerful new tool for sorting through and mapping all of California’s fatal and serious traffic collisions.
Starting today (Wednesday, April 6), anyone with access to the Internet can register for a free account to access the Transportation Injury Mapping System, or TIMS, to perform customized searches of 130,000 serious and fatal crashes in the state. Users can view the history of crashes from 2000 to 2008, the most recent year data are available, by county, city, neighborhood or along specific routes. Additional years of collision data will be incorporated into TIMS as they become available.
“This tool is meant to provide professionals and the general public with data to identify traffic safety problems and potential solutions,” said John Bigham, lead researcher for the TIMS project and the Geographic Information Systems program manager at UC Berkeley’s Safe Transportation Research and Education Center (SafeTREC). The center is based at the School of Public Health and the Institute of Transportation Studies.
The UC Berkeley researchers had a wealth of data from which to work. The California Highway Patrol (CHP) collects data on all reported crashes – including collisions on local roads as well as on state highways – and records the information in the California Statewide Integrated Traffic Records System. This database formed the foundation for the records in the TIMS project.
“I don’t know of any other state that allows the general public to access crash data in this way,” said Bigham.
Funding for this program was provided by a grant from the California Office of Traffic Safety (OTS) through the National Highway Traffic Safety Administration (NHTSA), whose Fatality Analysis Reporting System database was also used for TIMS.
While state and local records of crash data are publicly available through the CHP, there had previously been no easy way for users to interactively sort through the information and map it by such factors as location, time and date of the collision; weather and road conditions; the influence of alcohol; and whether pedestrians or bicyclists were involved.
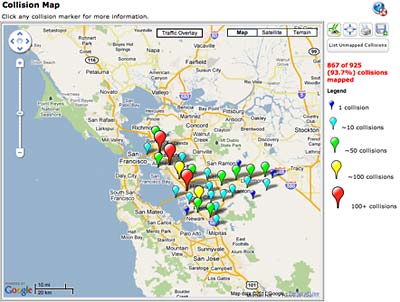
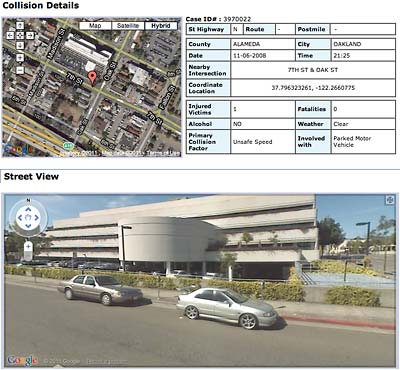
SafeTREC researchers set out to “geocode” the crash data by developing a process to add coordinates to each collision that involved a fatality or injury requiring hospitalization. They then created a web-based data query system that allows users to not only conduct searches and download the results, but to also visualize the results using Google Maps and ArcGIS Server, a mapping software from the Environmental Systems Research Institute. When users click on a location, pop-up boxes provide information about the collision, and the street view feature gives users a realistic picture of the collision site.
Other common data sources, such as census tract information, school locations and zip code boundaries, can be displayed on the maps. Users also have the ability to select collisions on the map and download the associated data files. Video tutorials and FAQs are available to help guide new users through the site.
“Actually seeing the crashes on a map is a tool in its own right,” said Bigham. “If a picture is worth a thousand words, a map is worth a thousand rows in a spreadsheet.”
According to NHTSA, motor vehicle collisions are the leading cause of death for people ages 3 to 34 in the United States. In California, records show that in 2008, more than 3,400 people were killed and more than 240,000 were injured in motor vehicle crashes. Those statistics include collisions with pedestrians and bicyclists. The California Department of Transportation estimates that traffic collisions cost $25 billion in economic damages to the state in a single year.
TIMS, which has been used by members of state agencies for beta testing over the past few months, will be of particular use to Caltrans, CHP and other agencies to better analyze crash data and focus their efforts to reduce traffic fatalities and injuries, the researchers said.
“TIMS represents a major breakthrough in California’s already strong record in road safety.” said David Ragland, director of SafeTREC and adjunct professor of epidemiology at UC Berkeley’s School of Public Health. “In the past several years, due to the effort and resources expended by several state agencies, deaths and injuries from traffic crashes have shown significant declines. TIMS will help build on this success by making it easier for our public agencies –and anyone with access to the Internet –to actually see the locations and types of crashes occurring on our state’s roads, to identify clusters of crashes and to help determine causal factors that can be modified.”
The researchers eventually plan to improve upon the TIMS website with the addition of data on minor injury collisions and more options for queries and spatial analysis of collisions. They emphasized that to truly evaluate the safety of a site, factors such as the relative volume of vehicle, pedestrian and bicycle traffic must be considered.
“The tools on this website allow you to simplify the first steps in exploring crash data, but these other elements need to be considered to get the full picture,” said Bigham. “In the future, we hope to provide more focused applications that incorporate many of these elements to provide an even stronger tool for crash analysis.”