How a network of sensors can help California's water system
Ziran Zhang, a civil and environmental engineering Ph.D. candidate at Berkeley, is up ahead breaking trail. The movement of his snowshoes creates a crunch-drag, crunch-drag rhythm. It’s almost spring in the Sierra Nevada, and the bright sun gives the snow underfoot the consistency of quickly melting shaved ice. Zhang pauses every so often, looking through the evergreen branches of the dominant fir and cedar trees for tall silver posts he installed last summer, before there was three feet of snow on the ground.
There it is, he’ll say, and crunch-drag off in that direction. He’s followed by professor of civil and environmental engineering Steven Glaser, a systems expert and Zhang’s advisor. The two are here, at about 8,000 feet in elevation, in an alpine bowl above Caples Lake, on the outskirts of Kirkwood Ski Resort, south of Lake Tahoe, to check on a massive environmental monitoring array they have constructed out of hundreds of wireless sensors. The goal is to collect enough data to build accurate models of California’s precious water supply, which comes from the snowpack stored in the state’s high mountainous reaches, like this one.
Some of Zhang’s posts hold a sensor station, equipped with a handful of measuring tools, while other poles have relay nodes to wirelessly transmit the information from each sensor array to a nearby base station. The base station compresses the data and in this case, because the site is so remote, beams it to a satellite and then back to Berkeley every 15 minutes.
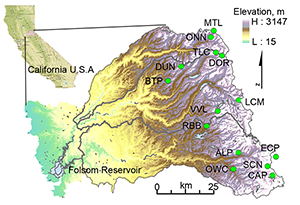
Having found the sensor station he was looking for, Zhang says, “This is just one of the 14 sites that we installed in the American River watershed.”
The American River headwaters run in three forks high in the mountains, braiding together behind Folsom Dam, east of Sacramento, altogether draining roughly 1,500 square miles. Once funneled through the dam, the American River continues on, meets up with the Sacramento River and eventually flows to the San Francisco Bay.
“Obviously, we can’t instrument all that area, so we’ve found representative physiographic regions and are looking at elevation, slope, aspect, vegetation and sometimes, the concavity of the surface,” Glaser says. “This site represents a much larger set of topography of the river basin.”
Better than average
California’s snowpack gets lots of attention, but it is also poorly understood. The health of California’s economic engines — agriculture, energy production, housing — all are directly linked to the amount of snow stored in the Sierra during a brief winter window, usually from December to March. But the record-setting drought of the past few years has underscored the need for a higher resolution picture of the entire water system.
“The historic way of measuring snowpack is to come out once a month with a pole and stick it in the ground and get your measurements,” Glaser says, while standing underneath one of the state’s orange snow survey markers, tacked high in a tree at the edge of a meadow. “The 30 state test sites tend to be very similar. You just get this one estimate once a month, and then that feeds into the averages,” Glaser says.
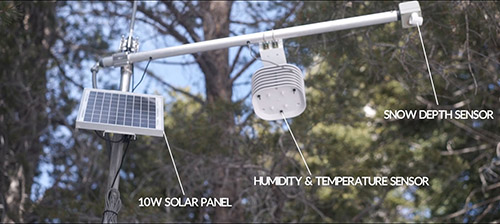
Each of the stations Zhang built contains monitoring equipment measuring air temperature, relative humidity, snow depth and soil moisture, sometimes at two different levels. Some sensor arrays are also outfitted with solar radiation sensors, “so you can do an energy balance of what comes in and what goes out,” Glaser says.
Finding the right location to place the sensors is just as important as obtaining frequent measurements. As Zhang explains, “There is an algorithm we use that’s called randomly stratified sampling. With the help of this algorithm, we pick the most representative locations to give us a measurement to capture both the mean and variance of the snow distribution.”
An observatory
Glaser first became interested in designing a massive, mountain-spanning sensor network after meeting Roger Bales (M.S.’75 CE), a professor of environmental engineering and director of the Sierra Nevada Research Institute at UC Merced. They collaborate, along with Martha Conklin, a UC Merced engineering professor who specializes in building hydrologic interaction and forecasting models, through the Center for Information Technology Research in the Interest of Society (CITRIS), a multi-campus research organization headquartered at Berkeley.
A decade ago, Bales, a hydrologist by training, was trying to obtain forest-level measurements in the Sierra. “We set up some fairly involved measurement systems. Our first ones, we had wires strung around the forest,” Bales says. Then he started looking for someone to build a wireless network, which led to Glaser.
“Our history goes back to the Southern Sierra Critical Zone Observatory, which is right above Shaver Lake, east of Fresno. Eight or nine years ago, we set up a wireless network with 50 nodes,” Glaser says. But the utility of the network was limited — radio performance was spotty and data was then recorded to local memory cards that failed when they got cold — so Glaser and one of his graduate students at the time decided to build a new system of hardware. They eventually started a company, Metronome Systems, to commercialize their sensor control and communication hub.
Reliable hardware meant scalability.
“And then Roger had this idea that we could look at this very large area and set up an observatory, so we call this the American River Hydrologic Observatory because then we can represent the entire basin by picking important areas. This is funded by the National Science Foundation because nobody has ever had this idea of making such an observatory,” Glaser says.
Similar to how distributed radio telescopes are linked to create a better defined picture of space, the Sierra sensor network team is trying to do the same thing across a massive landscape. The urgency for better information is exacerbated by a changing climate.
“The old statistical methods for forecasting aren’t going to be so good if the snow is changing. But more broadly, the state is going to be facing some tough questions about water allocation, water rights, water storage, and it’s our position that it is better for society if these decisions are better informed than they are now,” Bales says. “Too much of our past water decision-making has been based on limited information.”
This summer, with funding from the California Energy Commission and the California Department of Water, the team is building a new observatory in the Feather River watershed, which drains about 6,000 square miles of the northern Sierra Nevada as one of the Sacramento River’s largest tributaries. The river provides the water for the Oroville Dam, the source for the State Water Project. PG&E has significant hydroelectric generation capacity on the Feather River too. “We are starting a similar program there to provide data to PG&E so that they can do real time estimation of water that will come through their turbines,” Glaser says.
The High Sierra is an environment unique to California, but water stress and climate change are familiar in other communities and economies. Standing against a backdrop of granite crags poking out of steep mountainsides blanketed in receding snow, Glaser starts ticking through a list of other projects around the world seeking to build mountain sensor networks to measure snowpack, using the technology he has helped develop. One, for example, is a project in Chile, which was started by a Berkeley MBA student, and another is a project with a CITRIS collaborator, the French Institute for Research in Computer Science and Automation, in the French Alps.
The technology has uses beyond monitoring snowpack. Glaser is working with partners in the Philippines to use the sensors to monitor agricultural activities, and, closer to home, with the university’s botanical garden. There, a group of his students built a sensor station to optimize the irrigation of the humidity-loving Asian plant collection.
Like any major piece of infrastructure, scaling the sensor observatories up beyond a watershed will require capital to support the network’s operation and maintenance costs. Meanwhile, Glaser and his team are working on the UC Water Security and Sustainability Research Initiative, a project designed to best leverage the water-related research happening across University of California campuses. By incorporating Sierra sensor data from the American River Hydrologic Observatory, for instance, with other UC research data such as groundwater recharge at lower elevations — along with social science and policy research — a more comprehensive understanding emerges of what the future water system will look like. “It’s looking at the whole picture of the water,” Glaser says. “For the state of California, knowing where the water is, what little we do have, is vitally important, because that allows us to plan and use the water wisely.”